Issue 102
Term 3 2017
How are you using SCIS?
Ben Chadwick provides insight into the way subscribers use the SCIS platform - and how these statistics are being used to inform decisions about the next chapter of SCIS.
We collect quite a few statistics at SCIS. Besides enabling us to remain accountable within our broader organisation, our statistics inform our cataloguing practices, and help us seek out new services or make improvements to our current operations. For example, our search logs may show us that there is a particular book that we have not catalogued but that many subscribers are ordering.
More recently, with the upcoming launch of our new website, we have been consulting our usage statistics to get an idea of what features of our current site are best utilised. This will help us make the new site as useful, user-friendly, and value-adding as possible.
Looking back over some of our statistics for 2016, I thought I would take the opportunity to provide some feedback to you on SCIS usage.
Search
Statistics may come from a variety of sources, and I’ll begin with some data we pick up from Google Analytics. To sign up for Google Analytics, you need an email address registered as a Google account. You will then need to put a small piece of code on your website. It can tell you all sorts of information about who visits your site and what they do when they are there. We are particularly interested in knowing how various areas and features of our website are used.
In 2016, nearly 1.5 million searches were performed on the SCIS database. Google Analytics data showed that almost all searches within the SCIS catalogue were basic searches. In a small number of cases, users made use of the advanced search features (3.5 per cent) and browsing by subject or author’s name. This tells us that, while a range of search options are important for our users, it is the default search screen that gets the vast majority of traffic and therefore needs to be as user-friendly as possible.
Basic search
On the basic search screen, users have options for limiting their search. The default keyword search (‘Anywhere’) was used 80 per cent of the time. The most popular index used in basic search was Title contains (7 per cent), followed by Subject browse (6 per cent) and Standard number (5 per cent), which includes ISBN.
The basic search screen has options for limiting the search. The most prominent limit was resource type (13 per cent of basic searches) followed distantly by year of publication (2 per cent) and place of publication (0.3 per cent). Within the resource-type options, limiting by videorecording was by far the most used (89 per cent of resource-type limits).
Advanced search
In advanced search, users can select up to three indexes to search on. They can also apply one or more search limits.
Limits were used in 35 per cent of searches. Advanced search splits resource type into format (or ‘medium’) and content (or ‘type’). These were the most popular limits in advanced search, used in 19 per cent and 5 per cent of searches respectively.
In half of advanced searches only one index was selected to search on. These were keyword searches (Keyword anywhere) in 53 per cent of cases. When more than one index was searched on, just over half (53 per cent) involved at least one index besides keyword. Across all advanced searches, the most popular index was Keyword anywhere (91 per cent), but Title (24 per cent), ISBN (18 per cent), Author name (12 per cent), Series (7 per cent), Publisher name (4 per cent) and Subject keyword (3 per cent) were also used.
Our Google Analytics data makes it clear that the convenience and breadth of the default keyword search is popular among users. However, we must continue to enable users to hone in on specific works by their title and standard numbers and to gather similar works on the basis of their author, series, publisher, and subject. This is particularly important for advanced search, but true to a lesser extent in the default basic search as well.
We can also learn that searching for videorecordings (probably DVDs and Blu-ray) is an important workflow for our subscribers, and we should make it as easy and intuitive as possible.
Downloads
The applications we use also provide data, just as you would be able to run reports from your library management system (LMS).
In 2016, 62 per cent of our subscribers had their z39.50 capability switched on (enabling them to do their SCIS cataloguing within their LMS). Fifty-four per cent of subscribers downloaded from the SCIS website. This reveals a degree of overlap: almost 13 per cent of subscribers that use z39.50 still come to our website to download records, at least occasionally. People tell us they sometimes do this to use the advanced search features on the SCIS database, to find the correct record when an ISBN matches more than one title, or when they are trying to find a resource that does not have an ISBN or any other standard number to search on.
Over recent years we have seen a slow but steady uptake in automated importing of SCIS records into library systems. In response, we will continue to support z39.50, but we will also explore exciting contemporary web services for transmitting SCIS data to library systems. Having said that, we will continue to maintain our own presence and encourage subscribers to visit our site to read Connections, sign up for professional development, explore the database, and download records and cover images (and pay their invoices!).
SCIS subscribers download records for many things other than hard-copy books. In 2016, records for digital resources constituted 12.3 per cent of downloads. Figure 1 shows the frequency of non-book downloads, with digital video, ebooks, and websites being the most popular. Other resources included DVDs, kits, activity cards and flash cards, digital databases, mobile apps, audiobooks (online and CD), hardcopy games, music notation, posters and charts, music CDs, maps, and toys. These figures justify our policy on the cataloguing of good quality electronic resources to supplement libraries’ physical collections.
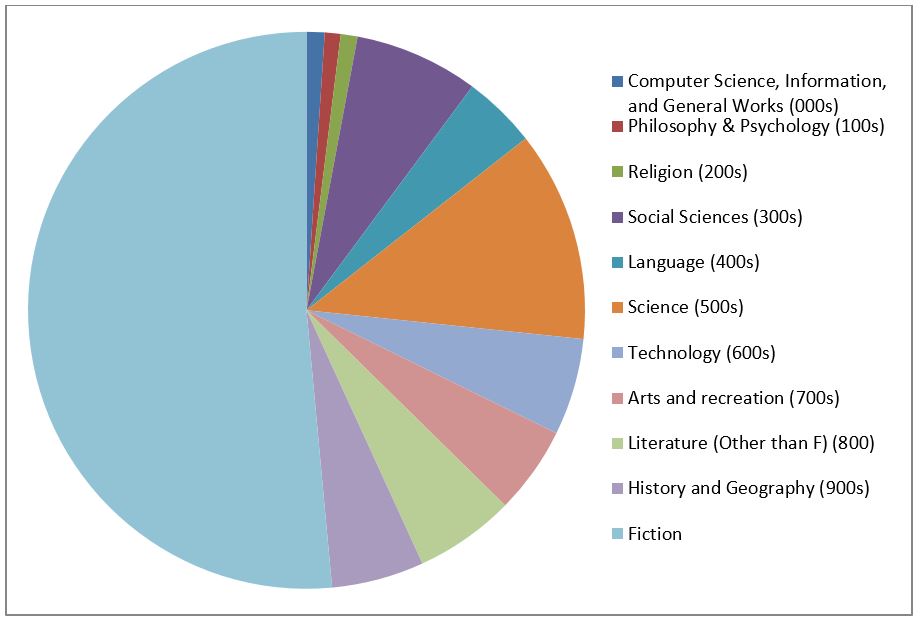
Figure 1 Downloads by resource type
In terms of resource content, based on Dewey classifications, the majority of downloads were for fictional works. Within non-fiction, the greatest interest was in science (12 per cent) and social sciences (7 per cent), with literature other than fiction, technology, history and geography, arts and recreation, and languages all coming in at around 5 per cent of downloads. While fiction is obviously central to any school library, it is interesting to see the prominence of STEM in the non-fiction collection, and we will continue to explore ways of supporting collection development to directly sustain curriculum delivery in schools.
Some of us are cursed with a love of statistics, but at SCIS they serve serious purposes beyond just pure enjoyment. I hope this snapshot has given you some ideas of the how you and other subscribers are using SCIS, and an indication of some of the directions they provide us as we maintain and reinvent our services.

Ben Chadwick
Manager, SCIS
Education Services Australia